Intermediate Power BI (session 2)
This is part of our intermediate-level Power BI desktop course. The course structure is as follows:
- session 1: a simple build-a-dashboard session as a warmup, reminder about core Power BI techniques, and sharing some suggestions for good workflow practices
- session 2 (this session): DAX language foundations, including FILTER and CALCULATE
- session 3: core PowerQuery functions to manage sources, join data sets, pivot, and tidy values
- session 4: PowerQuery M language foundations, including a basic overview of syntax, a core function toolkit, advanced mode, and reproducibility
- session 5: a second, more ambitious, build-a-dashboard session to put all that PowerQuery and DAX knowledge into practice
We usually expect participants to take the five sessions together in order. This course broadly follows-on from our BI for Beginner course, and assumes that you’re happy and confident applying all that material. We’d usually expect participants in the intermediate course to be capable of independently building a simple dashboard in Power BI. You’ll also need Power BI Desktop to complete the live sessions - the web/Teams versions of Power BI won’t work.
Previous attendees have said…
- 29 previous attendees have left feedback
- 97% would recommend this session to a colleague
- 97% said that this session was pitched correctly
- Well paced and the presenter took the time to tackle any questions raised and kept the session going well.
- great insight into what is clearly a very powerful approach to data manipulation prior to presentation. only wish I’d taken stronger painkillers for the headache before the session - feeling it now!
- Excellent trial examples - very hepful.
Session outline
In this session, we’ll concentrate on DAX. Specifically, we’ll:
- look in more detail at date tables as a warmup
- look at the foundations of DAX, especially concentrating on the differences between measures and tables
- discuss iterator functions
- think about the filter context, and the ways you can use (and modify) it with
FILTER()andCALCULATE() - introduce variables as a way of simplifying some DAX expressions
- and finish with a brief introduction to calculation groups as a means of reducing the number of DAX measures you need to write
Data
- this session uses a bit of synthetic data extending the Dundee traffic dataset from the previous session
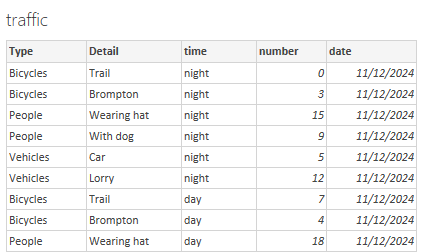
- please use this link to import into Power BI. You should be able to do that directly from the Excel connector.
DAX reminders
- functions vs formulas
- arguments and return values
- references
- columns vs measures
A warmup: date tables
We briefly discussed and implemented a date table in the previous session. Date tables are good practice, because they help you deal with patchy data (especially when you have missing dates), and prevent repetition by consolidating all your date info into one place.
- create a
datestable now using theMINandMAXvalues fromtraffic[date]- note that
dateis a reserved keyword, so probably better avoided as a table name
- note that
- now add some columns:
- a day of the week, using
WEEKDAY - a day name, using
FORMAT - a quarter, using
QUARTER
- a day of the week, using
- finally, check the model to ensure that your date table is linked to your traffic table
Column functions
- Many DAX functions can return either columns or measures
- let’s try a practical example:
- in the
trafficdata, selectNew columnthen add the DAX formulatemp_col = 66 - now repeat with
New measurethentemp_measure = 66 - now add
temp_measureto a card on a new report page
Column vs measure
- your
temp_xxxfunctions will be identical: the value oftemp_measurewill be the same as each row of thetemp_colin your data - the values are the same
- the filter context is also the same
DAX defaults
- now tweak your
temp_colformula to use theUPPERfunction on the[Detail]column:temp = UPPER(traffic[Detail]) - inspect the result
- an important result: DAX column functions default to row-wise filter context
- if you try the same formula in
temp_measureyou’ll cause an error: Power BI won’t know which row you want to change the case of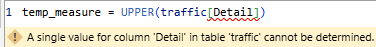
- this indicates a different filter context at play in this DAX formula when used as either a column or as a measure
FILTER()
- now update
temp_col = COUNTROWS(filter(traffic, traffic[number] = 3))
- note that this function now isn’t working row-by-row, but across the entire table
-
FILTER()has changed the default row-by-row context
Filter context
- to illustrate, please build a simple dashboard with:
- a card containing the minimum value of
traffic[temp_col] - a slicer containing
traffic[time]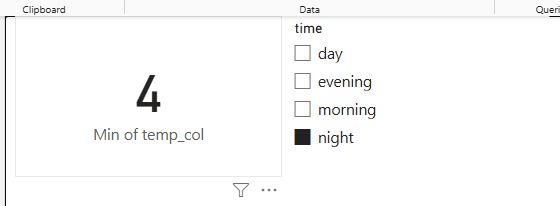
- a card containing the minimum value of
- note that the value of temp seems to be incorrect - it’s the same no matter how the slicer is set
Iterator functions
- add two new columns:
col_sum = SUM(traffic[number])col_sumx = SUMX(traffic, traffic[number])
- add two new measures
meas_sum = SUM(traffic[number])meas_sumx = SUMX(traffic, traffic[number])
- finally, add all 4 to cards, summarising by
minwhen necessary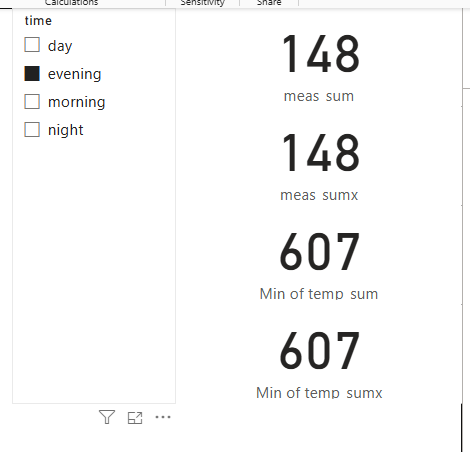
What’s the difference?
- in the measure,
SUM()takes the report filter context, and sums for that time of day - in the column,
SUM()calculates the total for an entire column - in both cases,
SUMX()gives the same result, but it calculates it in a different way…
SUMX()
- to illustrate, change both
SUMXcalculations toSUMX(filter(traffic, traffic[number] < 15), traffic[number])
- all four values will now disagree:
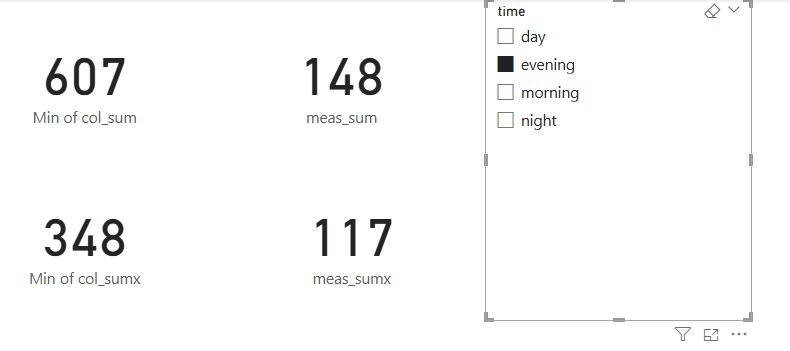
-
col_sumis showing the total for the entire column -
meas_sumis showing the total for the filtered column (sotraffic[time]= morning) -
col_sumxis showing the total for the filtered column (values oftraffic[number]> 15 only) -
meas_sumxis showing the total for the doubly-filtered column (values oftraffic[number]> 15 wheretraffic[time]= morning)
-
SUMX() is an iterator
-
SUMX()calculates row-by-row - in our initial case, it was calculating row-by-row, and then aggregating all the rows
- when we added a filter,
SUMX()included rows meeting the filter condition
ALL()
- strictly,
SUM(x[y])is a sweetened form ofSUMX(ALL(x), x[y]) -
ALL()removes any filter context to include every row of a table
ALL() and CALCULATE()
- much of the power of DAX lies in that ability to alter the filter context. Let’s tweak
meas_sumto show that:
meas_sum = CALCULATE(SUM(traffic[number]), ALL())- compare and contrast col_sum and meas_sum
-
CALCULATE()is a generic function that changes the filter context -
ALL(), as we’ve already seen, removes any filtering from the current filter context
ALLEXCEPT()
-
ALLEXCEPT()allows you to remove part of the filter context
- add an additional slicer to your report slicing on
traffic[Type] - add a new measure with
meas_sum_time = CALCULATE(SUM(traffic[number]), ALLEXCEPT(traffic, traffic[time]))and add to a card
- that should give you a measure that reponds to
time, but not toType - this could be extended - e.g. to
meas_sum_type_time = CALCULATE(SUM(traffic[number]), ALLEXCEPT (traffic, traffic[Type], traffic[time]))
Variables
- DAX formulas get horrid quickly. In this section, we’ll demonstrate the use of variables
- add a new measure:
temp_var =
  VAR my_var = 66
  RETURN my_var
Variable considerations
- useful to avoid repeating yourself
- also useful for avoiding clutter (e.g. component measures)
- local scope - you can’t refer to variables in other expressions
- potentially improve performance
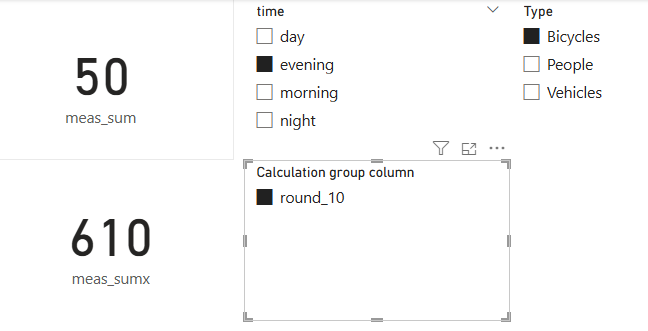
Calculation groups
- calculation groups are a way of applying functions to many measures at once
- in the model view, select
Calculation group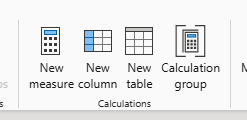
- select
Yeswhen warned about implicit measures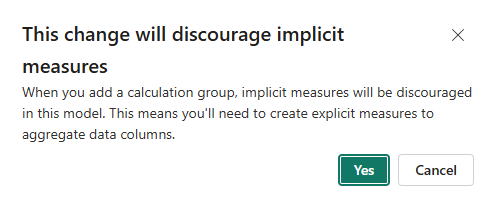
- that will add a new section to your model
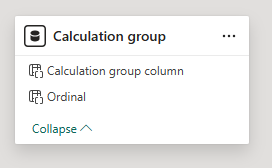
- select
Calculation itemin the Model sidebar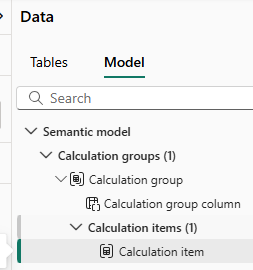
- add the formula
round_10 = ROUND(SELECTEDMEASURE(), -1)to the formula bar - back on the report page, add a slicer and populate with your Calculation group