


No feedback found for this session
Python in Excel
excel
advanced
Welcome
- this session is for 🌶🌶🌶 advanced Excel users, who are confident writing complex formulas, and ideally have a bit of prior Python (or similar coding) experience
Acknowledgements
Session outline
This is still extremely early in development, so tba.
Hello world
- in a cell, add the formula
=py("hello world")and green tick - several things to note:
- Non-standard formula bar
- Remote execution of that code
- Implicit print
- Effectively nesting Python code inside
PY()function (Inspect Formulas) -
Ctrl+Enterto commit
Return values
-
PY()has a choice of return values
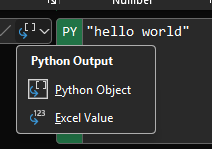
Reminder about array formulas
- array formulas produce several values from one cell of formula
-
=RANDARRAY(3, 1), for example - new and alarmingly experimental in places. Especially, note conflict with tables
Python list
- Update your python Code to
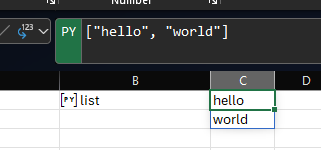
["hello", "world"\] - this creates a List
- copy paste that formula to another cell
- now switch outputs of one from
Python ObjecttoExcel Value - Look at the output - Excel is an array, Python a list
- Inspect formulas - different return value argument inside
=PY()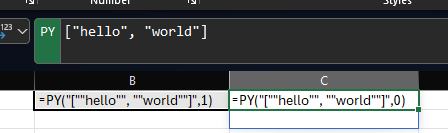
.[arrayPreview] to show values from Python preview
Python tools

Excel values into Python
-
xl()with a valid Excel reference or name - single cell via A1 or name
- table or table column by name or structured reference
DataFrame
We’d probably be better thinking of this as a method of using Pandas in Excel, rather than Python
- create a table with a named column containing numeric values
-
=PY()with Excel Values usingxl("Table2[val]").head()
A major annoyance
-
xl()defaults to taking values without headers, basically preventing the use of selection by column name xl("Table2[#All]", headers=True)- list of column names for many cols
xl("Table2[#All]", headers=True)[["val2", "val"]]
Define objects
df = xl("Table2[#All]", headers=True)df[df["val"] > 5]
.loc/.iloc
-
df.loc[df["val"] > 5, "val2"]= label-based selection -
df.iloc[2:4]= index-based selection
Summaries
df["val"].mean()df["val"].describe()
Meals
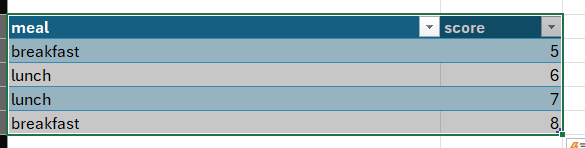
meals = xl("meals[#All]", headers=True)

meals.groupby("meal").mean()- do
meals.groupby("meal").value_counts()and show dynamic array meals.pivot_table(columns=["meal"], values="score")-
meals.plot()and linked references
meals["occurrence"] = meals.groupby("meal").cumcount()

meals.pivot(index = "occurrence", columns = "meal", values = "score")