PowerQuery - a practical introduction
excel
intermediate
NoteSession materials
- all materials
- slides
html / pdf
Previous attendees have said…
- 40 previous attendees have left feedback
- 95% would recommend this session to a colleague
- 88% said that this session was pitched correctly

NoteThree random comments from previous attendees
- Great session, but seemed like started from an intermediate level. I wish you explained from a realistic data(not original) and explained the process. Anyway looking forward to the next session.
- Super helpful to see Power Query in action
- Being totally new to Power Query I found it very informative. Would be worth saying pre-requisite is Excel 2016 and above required. I currently have Excel 2013 which didn’t allow me to have a go at the time, but was still worth just watching.
TipForthcoming session(s)
| Booking link | Date |
|---|---|
| PowerQuery - a practical introduction | 10:00-12:00 Wed 18th February 2026 |
Welcome
- 🌶 this session is a beginner-level introduction to PowerQuery
- you’ll either Excel desktop (>2007) or Power BI desktop
- you’ll also need to have basic competency in Excel or Power BI
- this session is based on our Power BI for Beginners course
- but PowerQuery isn’t specific to Power BI - it’s brilliant for Excel too
Session outline
- what is PowerQuery, and why might you use it?
- getting data into PowerQuery
- basic data wrangling
- joins (merges)
- pivots
What is PowerQuery?
- Microsoft call it a “data transformation and data preparation engine”
- it’s been around since 2010, initially in Excel, and then in both Excel and Power BI
- uses code (M Formula language) but has GUI tools for most tasks
How I think of PowerQuery
- the right way to load any real data into Excel
Why might you use it?
- powerful
- easy, to start with at least…
- allows you to standardise data loading from different sources
- allows you to repeat data loading
Getting data into PowerQuery
- Open Excel and create a new, blank, workbook
-
Data>Get & Transform Data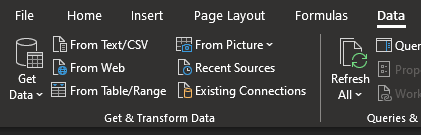
- Pick
From Weband supply the following URL -https://raw.githubusercontent.com/rfordatascience/tidytuesday/master/data/2023/2023-07-25/scurvy.csv - From the preview, select
Transform datato open PowerQuery
- Open Power BI and start a new report
- Select
Get data>From Webbutton in the ribbon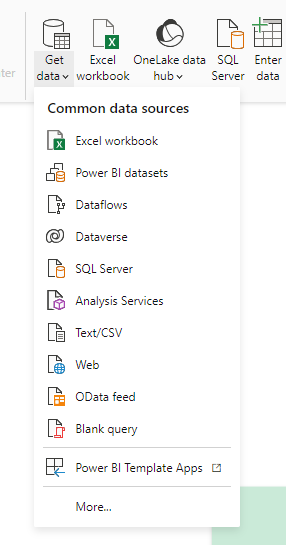
- Supply the following URL -
https://raw.githubusercontent.com/rfordatascience/tidytuesday/master/data/2023/2023-07-25/scurvy.csv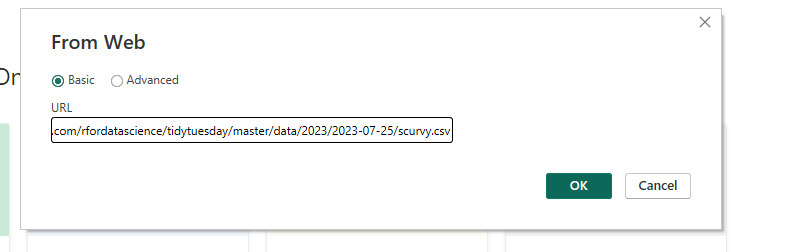
- From the preview, select
Transform datato open PowerQuery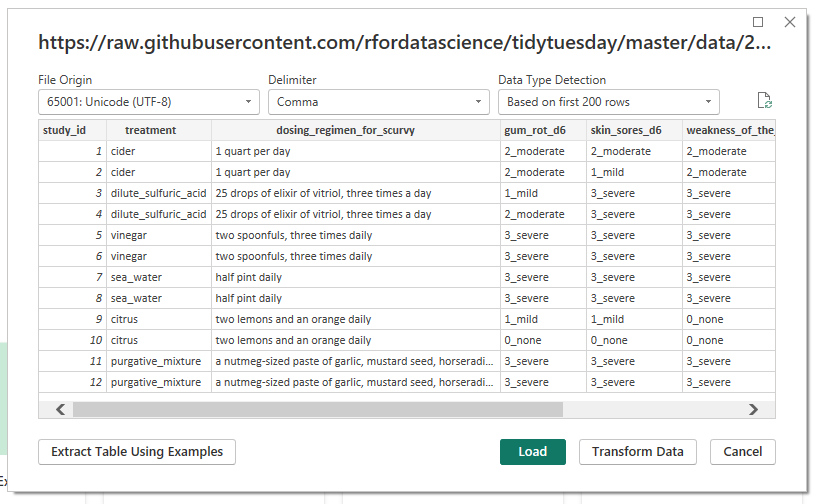
- If you’ve already got some data in your report that you’d like to transform, use
Tranform datain the ribbon to open PowerQuery: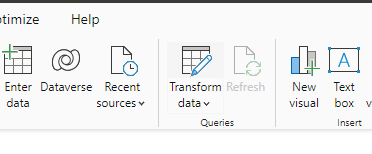
- this is historical data about scurvy testing from the medicaldata r package
Preview your Data
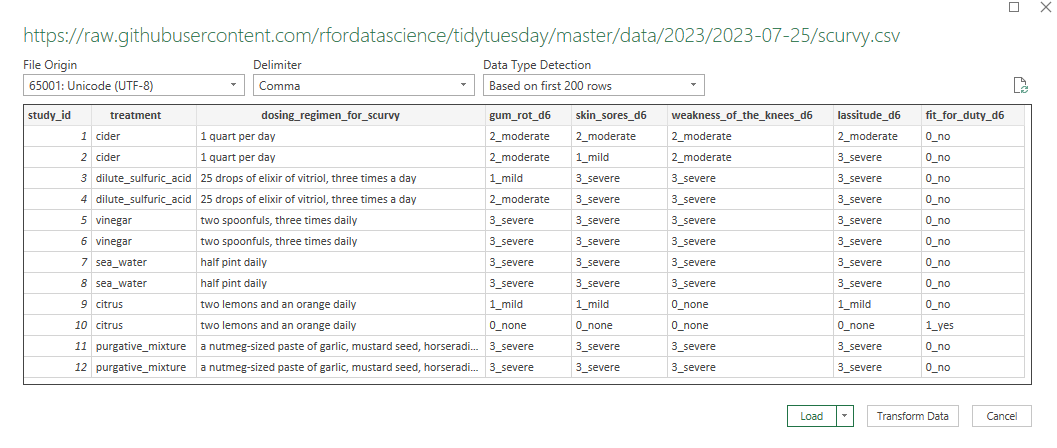 (make sure to click
 Transform data)
First view of PowerQuery
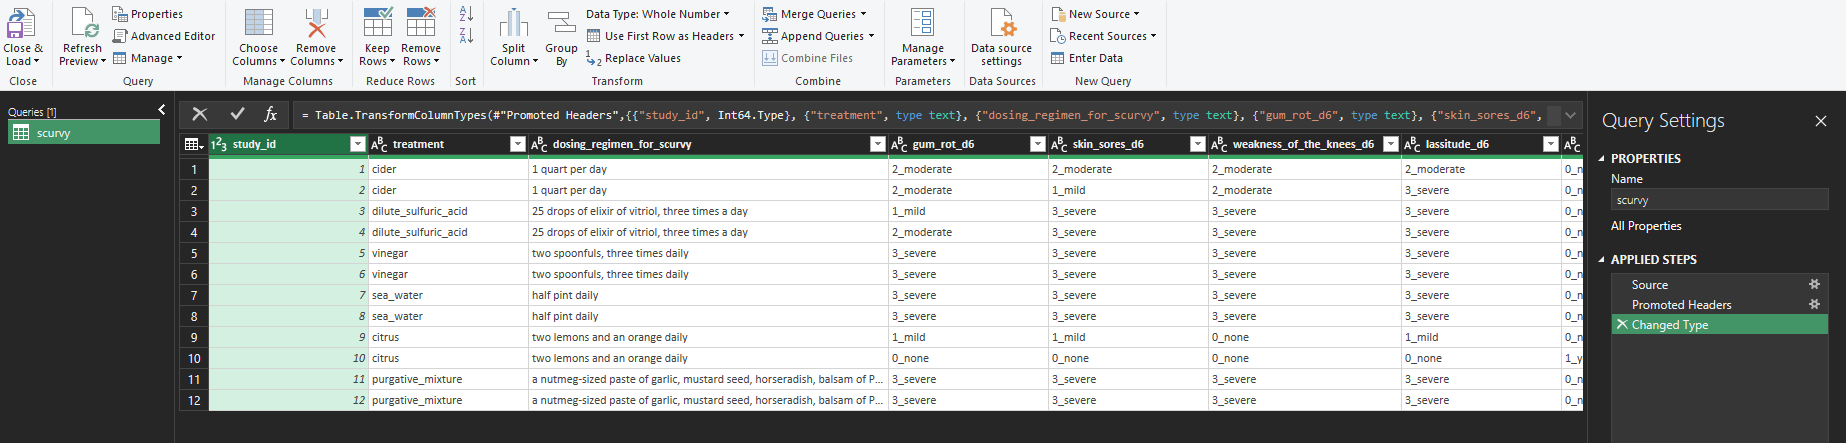
- Queries (= datasets) on the left
- ribbon menu at the top
- Query settings (= the changes you’ll make to your data) on the right
- Excel-ish data preview in the middle
Basic data wrangling
- right click the
study_idcolumn and selectRemove- the column will disappear
- but you’ll also gain a step in your Applied Steps field
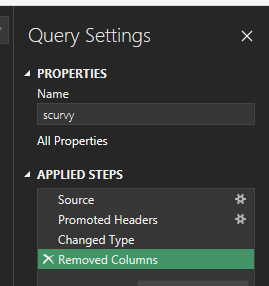
- you can edit this step
- if you’re code-confident, you can edit the formula to read
= Table.RemoveColumns(#"Changed Type",{"study_id", "treatment"})to also remove the treatment column - and you can remove the step using the X next to the step name

- if you’re code-confident, you can edit the formula to read
- you should also try renaming and reordering your columns in the same way
- once you’ve had a play, please remove the steps until you’re left with the data you started with (so delete back to “Changed Type”)
Replacing values
- we can also work with individual values
- our values are a number, then an underscore, then a word
- we can
Split columnat the underscore - we could also replace the odd underscores in the treatment column
Reshaping data
- we could go column by column here splitting, but an easier approach would be to re-shape the data
- select the first three columns, and select
Unpivot Other Columns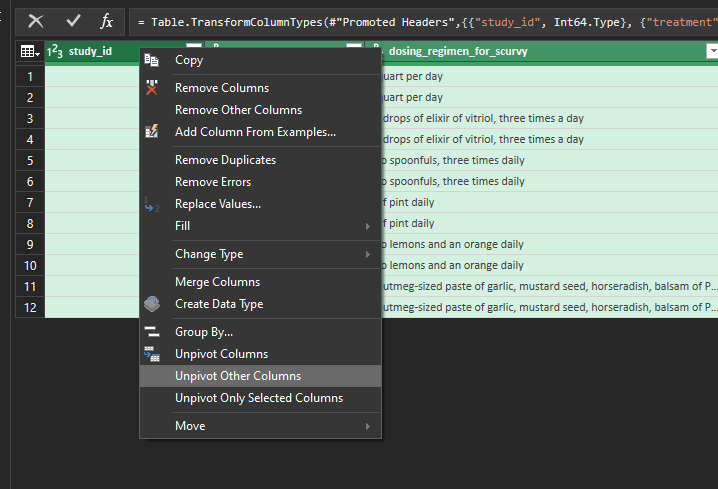
- then split, change type, and generally tidy up
Add columns
Our treatment and dosing columns are annoying. Let’s make a new, joined, column for them:
- select
Custom Column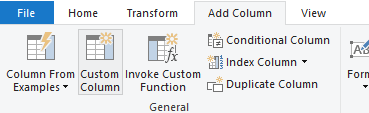
- you can click the gearwheel next to the step if you’d like to go back and tweak
Close and load / Close and Apply sends your data back to Excel/Power BI

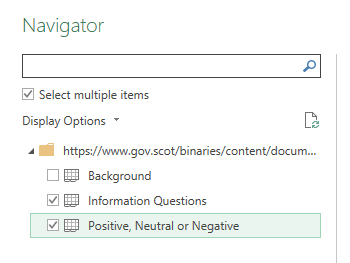
Getting more fancy: a bigger dataset
- please load the Health and Care Experience survey results from 2023-4
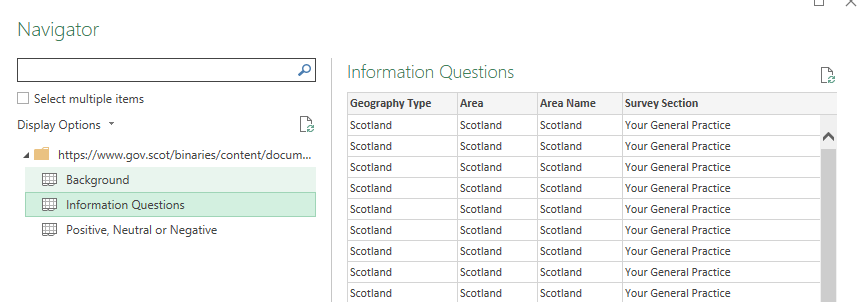
- or alternative local version
- please load both the proper datasets (and ignore the background)
A challenge
Can you find the number of responses to each question for your local NHS board? You should be able to re-work this data to give something like: 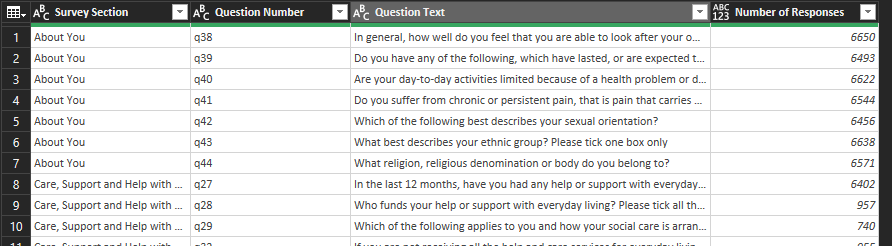
Some hints
- filtering works like Excel, but is destructive
- unpivoting, doing something to all the rows, then re-pivoting is a great way to work across lots of columns
- you can join structurally similar datasets using
Append Queries as New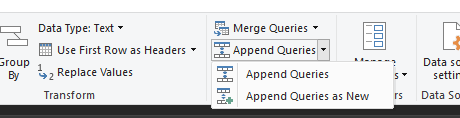
- you can deduplicate entire datasets by selecting all the columns and using
Remove Rows>Remove Duplicates