No feedback found for this session
Practical Power Pivot
excel
intermediate
Welcome
- this session is 🌶🌶, so it’s designed for intermediate users with plenty of previous Excel Pivot Table experience
- this session is not a general introduction to Pivot Tables in Excel
- instead, it’s designed as a high-level introduction to Power Pivot
Session outline
- check that you have Power Pivot please!
- useful guide for M365
- PowerPivot infrastructure varies widely, so we can’t advise on installation
- find and tidy some data in Excel
- add to Power Pivot
- look at the data model and create relationships
- create a pivot table from that data
- create calculated columns in the data model
- create measures and add to a pivot table
Words of warning
- Power Pivot is glitchy
- Power Pivot in Excel is still officially supported, but has been largely replaced by Power BI
- I’d be very circumspect about its long-term prospects
- I’d also be cautious about starting more ambitious projects in Power Pivot
- That said, knowing a bit of Power Pivot is definitely worthwhile - especially if you’re not able to use Power BI etc
Nutshell
- PowerPivot = effectively a local SSAS
- that means PowerPivot allows you to do fancy relational work with your data
- it can also means higher performance with large (10k rows +) data
- yet allows you to use Excel for data ingest and output
Data
- download the Agatha Christie dataset as an Excel file
- tidying:
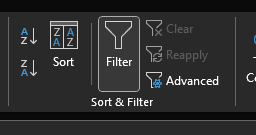
- remove filters
- create 4 x named tables for each of the four main data sheets:
novelsshort_storiesshort_story_collectionsall_titles
- remove filters
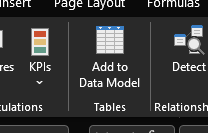
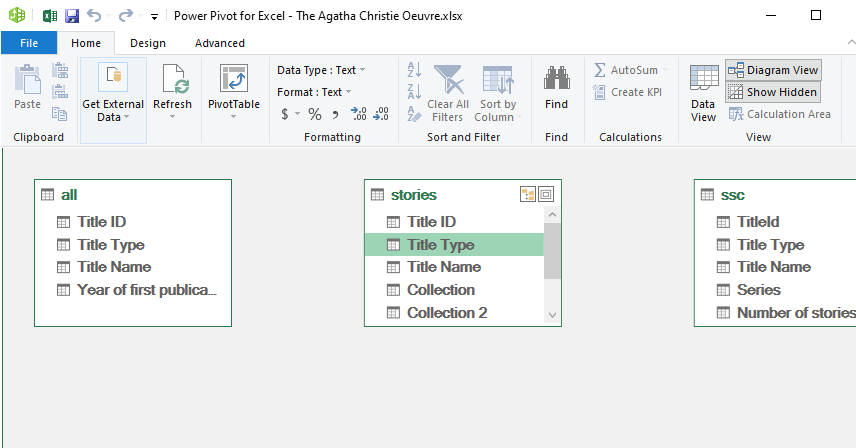
Add data to Power Pivot
- find Power Pivot in the ribbon menu
- now add each table in turn to your data model
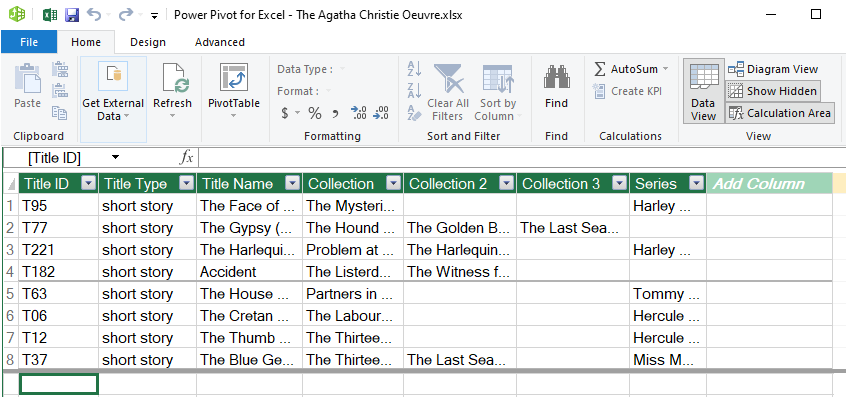
The data view
- data view
The diagram view
- diagram view
Relationships
- you can create relationships between different parts of your data
- that’s useful as you can then exploit those relationships using DAX formulas
- open the diagram view, and connect the other three
Title IDcolumns toall_titles[Title ID]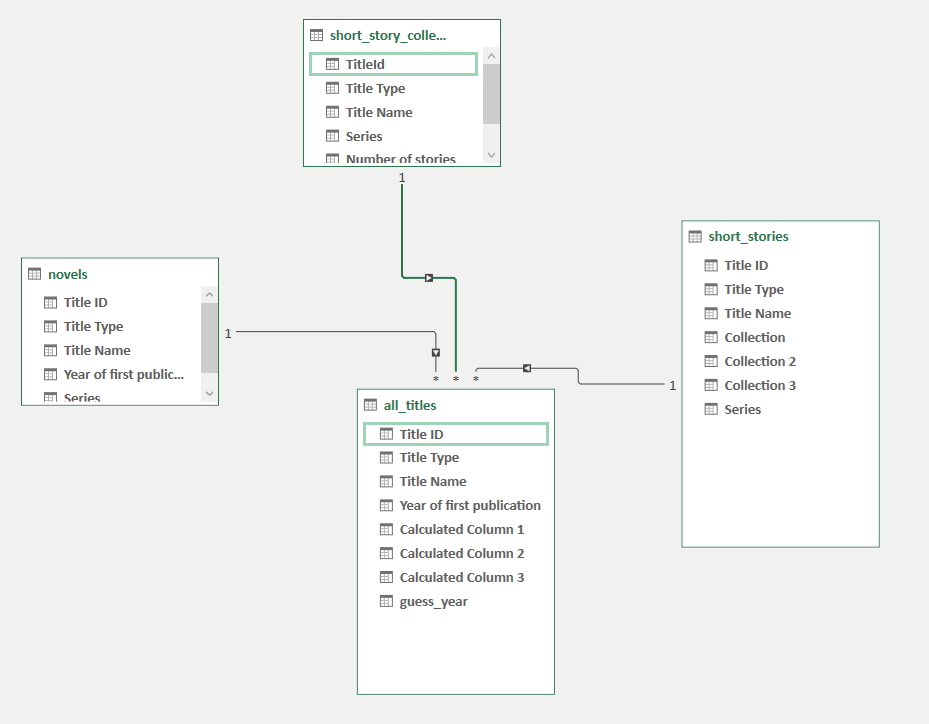
Relationships have directions
(with thanks to Michael Robb, NHS Highland) 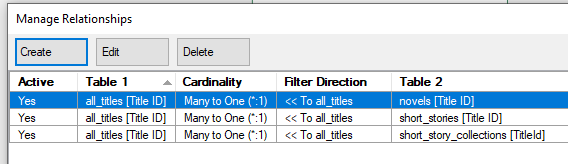
Make a Pivot Table
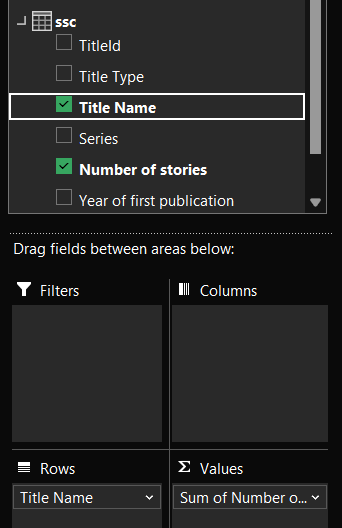
- this should feel nice and familiar: please insert a pivot table (from Power Pivot)
- that should bring up a nearly-standard set of pivot table tools. One immediate difference though: you can work across several tables
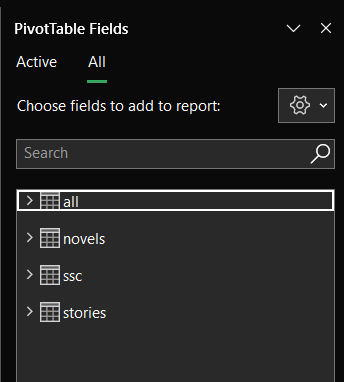
Make a Pivot Table
DAX
- Power Pivot is based on DAX (Data Analysis eXpressions)
- similar to Excel formula language
- a major difference: you can’t reference individual cells
- we’ll use structured references:
table[column]
Make a new column
=MROUND(short_story_collections[Year of first publication], 10)- rename to
Decade - refresh your pivot table, and add a decade column
Fancier calculated columns with DAX
- add a series col to your all_titles data
-
=related(novels[Series]) & related(short_stories[Series])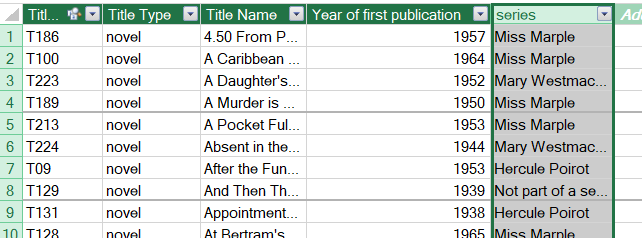
Fancier calculated columns with DAX
- add a
publication_yearcolumn to your short_story data -
=LOOKUPVALUE(short_story_collections[Year of first publication],short_story_collections[Title Name], short_stories[Collection])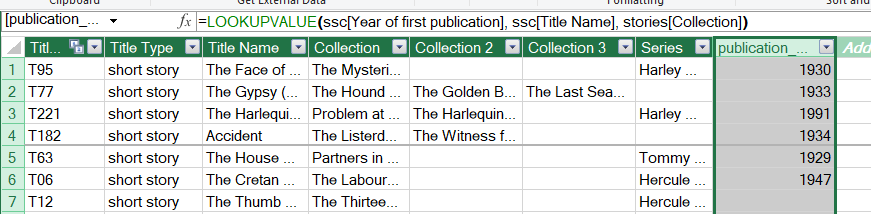
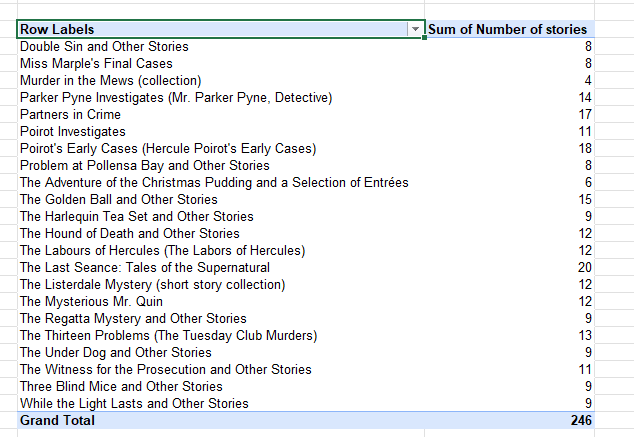
Calculated columns work as ordinary pivot table data
- remember to refresh the data
- you may also need to re-create your pivot table if you add tables/relationships: glitchy!
Creating measures
- another way of using DAX to create values
- insert from the Power Pivot menu:
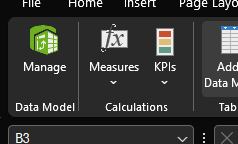
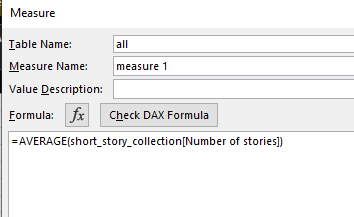
- then populate with a simple DAX calculation:
=AVERAGE(ssc[Number of stories]) - note the Table Name (which is where your measure will live)
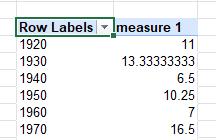
Using measures
- you can then insert your measure in a Pivot Table
- first refresh your pivot table
- then look in the table you set as the Table Name to find your measure:
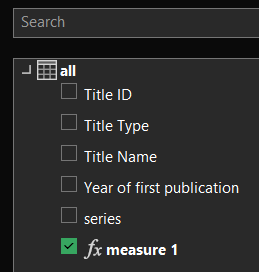
- now drag the measure to the
Valuesfield, and then populateRowswithshort_story_collection[Decade]