# A tibble: 3 × 2
    cyl   mpg
  <dbl> <dbl>
1     4  26.7
2     6  19.7
3 8 15.1Shiny from scratch
R
intermediate
Shiny
NoteSession materials
Welcome
- this is an 🌶🌶 intermediate-level practical session designed for those with prior R experience, but who are new to Shiny
- it’s definitely meant to be a taster session, rather than a comprehensive introduction
- we’ll concentrate on the Shiny-specific material here, and assume that you’re generally familiar with ordinary R
Session outline
- What’s the point of Shiny?
- Key resources
"hello world!"- Adding R code
- Capturing user input
- Thinking about reactivity
What’s the point of Shiny?
- a way of publishing interactive R code
- here’s a minimal Shiny dashboard which we’ll build in this session
Key resources
- you’ll need:
- R 4.0+ and Rstudio/posit.cloud/Posit workbench/VSCode
- the
shinyandreactlogpackages - the Shiny cheatsheet
- Mastering Shiny (very helpful, but optional)
Boilerplate Shiny code
- start a new R script in an empty project
- save as
app.R(conventional, but helpful) - start typing
shiny, and select theshinyappsnippet to insert the boilerplate Shiny code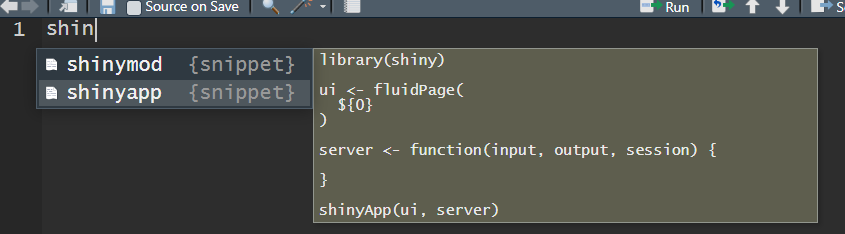
3 sections
-
ui, where you’ll build your user interface -
server, where you’ll put the bulk of your R code -
shinyApp, which collects theuiandserver, and runs your Shiny server
"hello world!"
- now add
"hello world!"in theui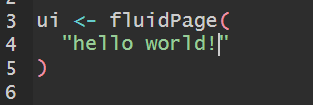
-
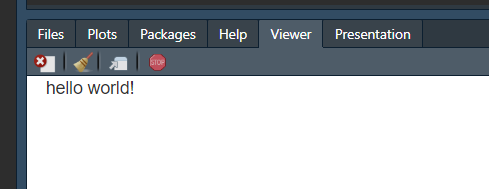
Ctrl+Shift+Enterto run your code - or use the run app button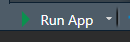
- that should start your Shiny app - and you should see “hello world!” in the viewer pane
- Press stop
 - or hit
 Escto stop your app. You’ll need to stop and restart to see changes.
Adding R code
- now we’ll add some simple R code to our
server. That’s going to do something simple with mtcars:
renderTable, output$, and tableOutput
- if we run our Shiny dashboard now, we won’t see any output from this new R code
- we’ll need to add three new elements to make the code work
- wrap our mtcars code in the
renderTablefunction inserver - assign that
renderTableto a variable calledoutput$my_table - finally, replace your
"hello world!"in theuiwithtableOutput("my_table")
Your code should now read:
library(shiny)

ui <- fluidPage(
  tableOutput("my_table")
)

server <- function(input, output, session) {
  output$my_table <- renderTable(mtcars |>
                dplyr::group_by(cyl) |>
                dplyr::summarise(mpg = round(mean(mpg), 2)))
}

shinyApp(ui, server)
Run it (Ctrl + Shift + Enter) and you should see a table of mtcars data in the viewer pane: 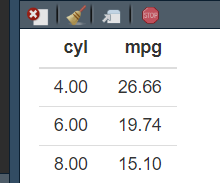
What’s going on with renderX etc?
there are pairs of functions on the Shiny cheatsheet. Each output type has its own
renderXfunction, which you use in theserverto wrap other kinds of output. SorenderPlotcollectsplot/ggplotoutput etc.once your output has been rendered, you then save it into a list variable called
output. Each bit of output needs its own variable name - likeoutput$my_tablefinally, and again from the Shiny cheatsheet, you extract your data inside the UI from the
output$variable by using anXOutputfunction that corresponds to yourrenderX
Capturing user input
- we need to add three elements to capture user input:
- add an input widget - like
radioButtons()above yourtableOutputin the UI. You’ll need to comma-splice that - all your UI contents gets joined with commas - then add an input ID to that input widget
radioButtons("my_input", "Which gear to show?", sort(unique(mtcars$gear))) - finally, you connect your user input into your code using
input$my_input
ui <- fluidPage(
  radioButtons("my_input", "Which gear to show?", sort(unique(mtcars$gear))),
  tableOutput("my_table")
)

server <- function(input, output, session) {
  output$my_table <- renderTable(mtcars |>
                dplyr::filter(gear == input$my_input) |>
                dplyr::group_by(cyl) |>
                dplyr::summarise(mpg = round(mean(mpg), 2)))
}
Thinking about reactivity
- all this extra work is needed to allow Shiny to run reactive code: code that responds to user input by producing different outputs
- that’s a big difference from standard, declarative, R code
- one helpful tool for understanding reactivity: reactlog
Reactlog
- run
install.packages("reactlog") - then add
library(reactlog)to the start of your Shiny script to attach the package - then follow that with
reactlog_enable()to start logging - now launch your dashboard, interact with it a couple of times, and then press
Ctrl+F3 - that should bring up a new webpage showing you the reactive graph of your Shiny app
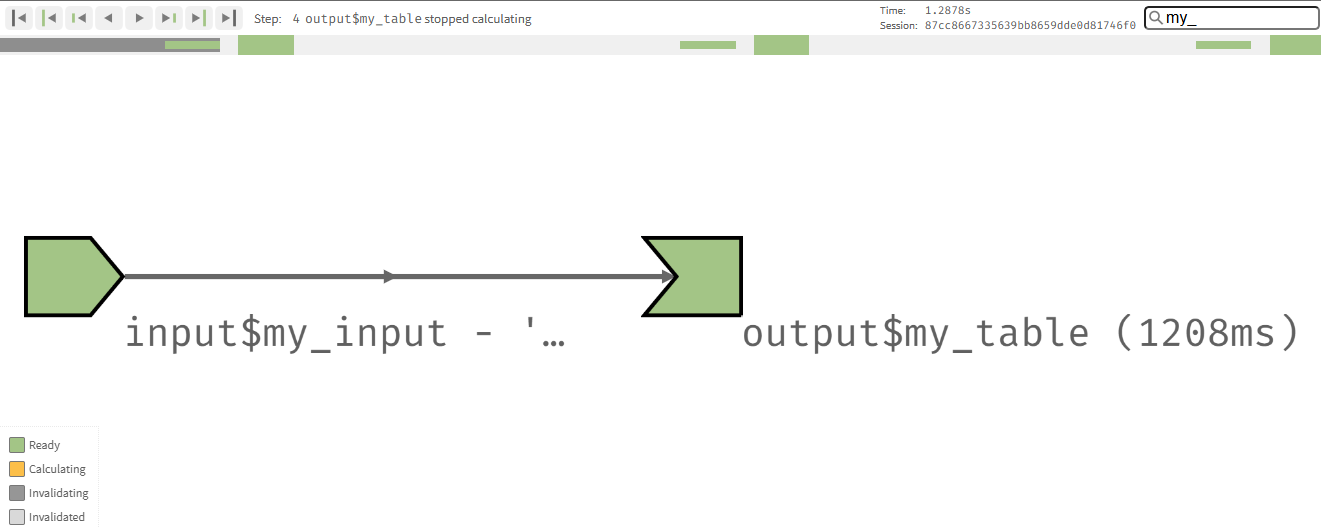
- conveniently, Mastering Shiny uses the same visual style to explain the reactive graph as
reactlog