 KIND Community Standards: Visio SOP
Purpose
This is a sample standard operating procedure for staff using Microsoft Visio for process mapping and information visualisation within their health, social care, or housing teams. The document is not exhaustive and additional information can be found in the the appendix.
What is Visio?
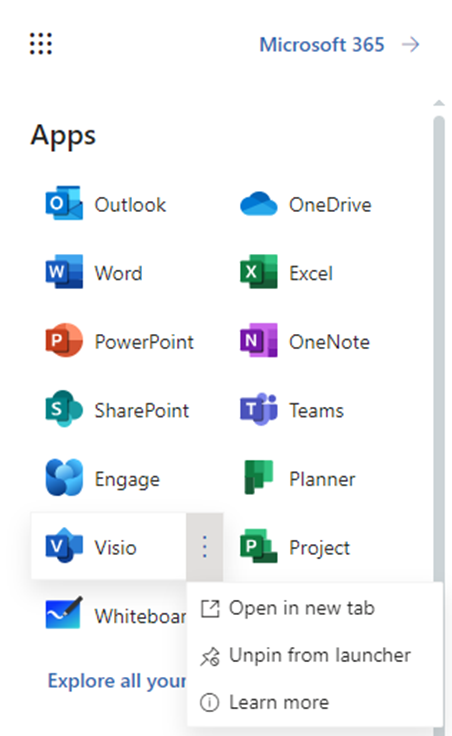
Visio is a visualisation tool provided within the Microsoft 365 suite of software. All staff will have access to the online version of the app. You can find the app within the office application launcher (the waffle icon in the top left of the screen when using any office 365 applications on the web) (Figure 1)
Visio can be employed for a variety of uses, such as:
- Process mapping;
- Flowcharts;
- Matrices;
- Venn diagrams;
- ‘Swim lane’ diagrams;
- Step plans such as communication plans.
Visio has several set templates that can allow users to begin from a pre-designed example. This can enable users to quickly produce a clear, concise and professional looking diagram if they know the format they would like to present their information in.
How to use Visio
Blank template
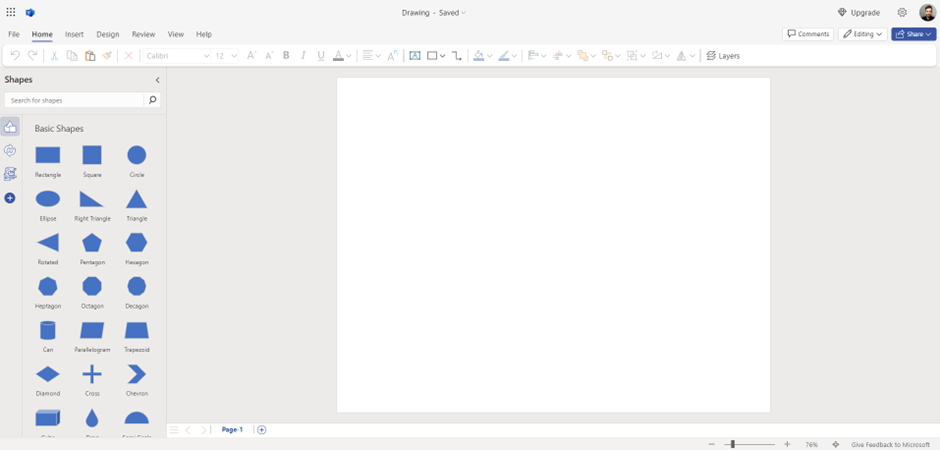
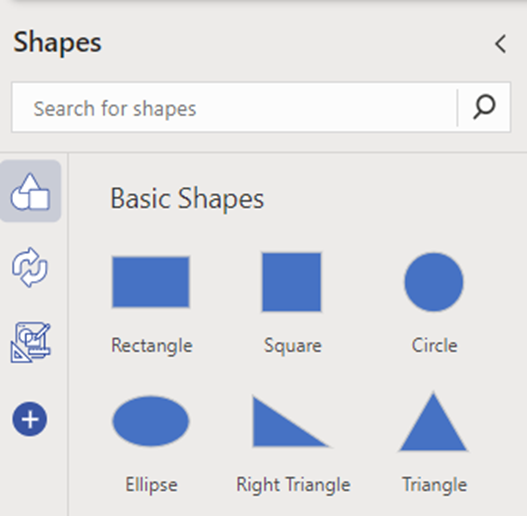
If starting with a blank template, your workspace will be a clear page. Visio will provide a ‘shapes’ tab on the left side, with which you can begin clicking and dragging to populate the diagram.
N.B. If you are doing traditional flowchart process mapping, certain shapes have certain meanings. For example, a circle usually denotes the start/end of a process, and a diamond denotes a decision (which will have branching YES or NO results). For more information, see Process Mapping Symbols in the appendix.
Once on the page, Shapes can:
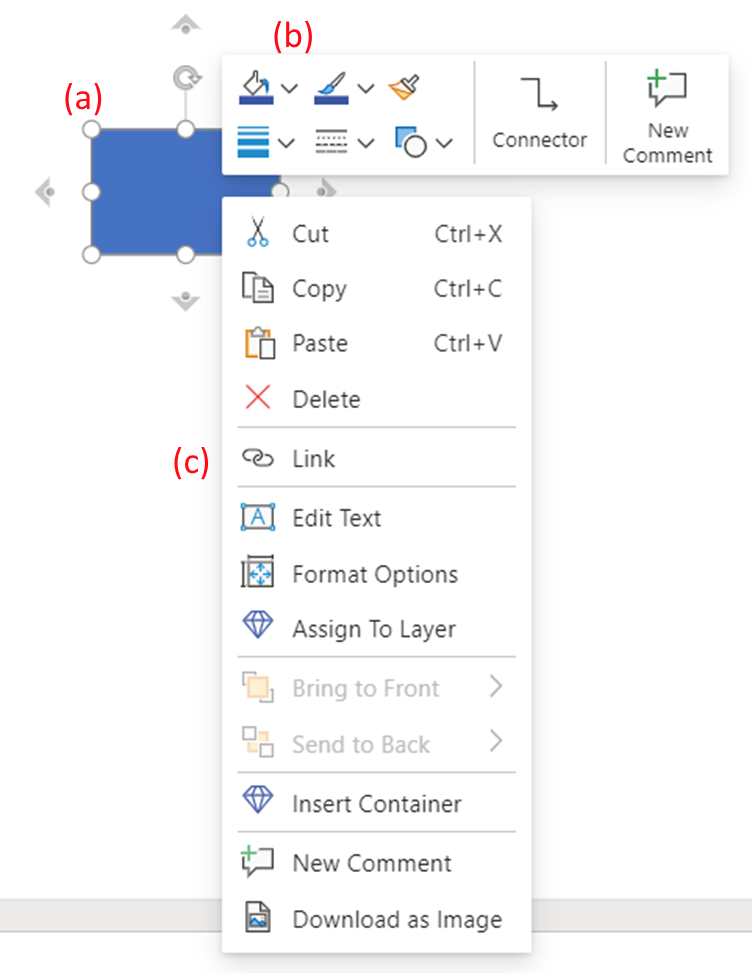
- Change size: Click on the shape and click + drag on the points that appear at its corners/edges to alter its dimensions (Figure 3, a)
- Change appearance: Right click on the shape, and use the ‘shape fill’/’shape outline’/’weight’ and ‘dash’ icons that appear in the window to edit the appearance of the shape (Figure 3, b)
- Contain a link: The shapes can be edited to become buttons that will send viewers to a hyperlink when clicked. Right click on the shape, choose link from the window, and enter the URL that you would like the shape to direct to. ‘Add display text’ will show text that appears when viewers hover over the button, you can use this to provide a simplified link address or additional context (Figure 3, c)
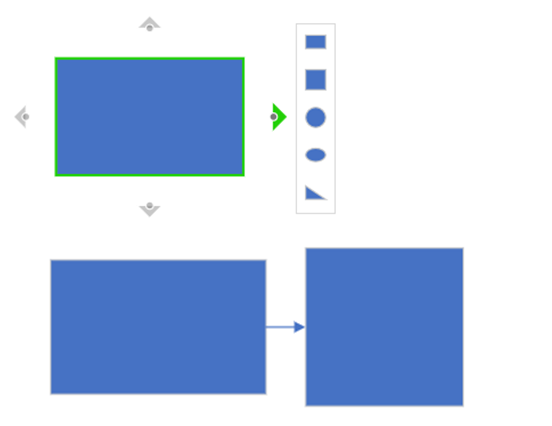
- Be connected to other shapes: hover over the shape (without clicking) and green points will appear. If you click and drag from these points, Visio will generate an arrow that can be connected to another shape. Alternatively, some directional arrows will appear around the shape; if you hover over these; Visio will suggest new shapes that you can choose from, and it will auto-populate that shape connected to your original shape. (Figure 4)
Other options are available to you on the Shapes panel on the left side of the workspace:
Working from pre-designed templates
If starting with a suggested template, your shapes panel on the left side will appear slightly different, to provide shapes that match the diagram intended. For example, if you are looking to create a Venn diagram, the shapes panel on the left will provide you with suggested overlapping shapes of 2-sets, 3-sets etc. Think (as a team if necessary), about what you are looking to produce before you begin and in what format this would look best/be most accessible/understandable, and choose the corresponding set template to get yourself started.
Tips for getting the most out of Visio
- Plan out beforehand, either alone or with your team as appropriate, what format would work best for the information you are trying to provide. The same information can be provided in many different ways, and often one format will work better than another for the information you are trying to visualize. For example, a swim-lane diagram is better than a traditional process map when attempting to show responsibilities moving across different contributors/organisations.
- Once you have a shape on the diagram that works well (has been sized, coloured and outlined in the manner that you want), you can copy and paste this shape instead of having to create it from scratch again. This helps massively with saving time, and helps generate a uniform formatting within the diagram.
- Visio’s workspace is reactive and will automatically grow if you exceed its borders. This is useful to know as it means you do not constantly have to move or re-shape your items to remain within the borders of the page. You may find it easier to generate all of the items for your diagram first, and move/locate/connect them all later on, once you have a feel for the amount of space your diagram requires.
- Include a legend – provide a legend somewhere alongside the diagram, indicating what the different shapes, colours and connections mean (especially if the diagram becomes more complicated).
- If it is difficult to fill in pieces of a process map because the information is poor or there is no information, don’t worry - this is also really useful information! Mapping out systems can identify gaps or weaknesses in the current process. Wherever this occurs, make a note of it, and when analysing the map with the team during review, explain the difficulties encountered to the team. This will prompt them to provide the missing information, and/or cause them to review the current process for quality improvement.
Time to complete/resource allocation
Simple Visio mapping can be quite quick, especially if using suggested template shapes to complete a task. However, complex diagrams can be quite tedious and time consuming to prepare.
As a result, any team member undertaking a complex process mapping task should be able to discuss with their line/work management how much time they can allocate to this, reasonable/realistic deadlines, and expectations alongside other work. If generating a visualisation like this is urgent, then the team member should be able to give priority over their other work to the task.
Process mapping is an excellent development opportunity as it is a flexible skill valuable to many different roles and teams. Anyone should be encouraged to try out using the tool where relevant to their work, or simply as a PDP exercise to familiarize themselves with the process.
Example exercises
Below are some sample exercises to practice with to get a handle for the application.
- Practice connectors: create a map of your team, showing the line management and reporting structure.
- Consider using different colours for different groups, and adding a legend to explain what the colours represent.
- Try to do this exercise on a blank template, and then afterwards, you can repeat the exercise using one of Visio’s Organisation Chart templates.
- Practice flowchart branching: Create a process map about your morning routine and your journey to work. Include a couple of decisions that create branching routes, e.g. do you walk to work > Yes / No > map an alternative route to work if you take the bus.
- Practice Comms: use one of the Infographics templates to make a short summary of your team’s milestones over the last year or in the year ahead.
Appendix
Overview
Many more suggested articles are available on the Visio website itself; click on the help icon (? Symbol) in the top right of the page, and several articles about using the application will be suggested.
Process Mapping
- Process Mapping (QI Lothian)
- Process Mapping (Turas Quality Improvement Zone)
- Process Mapping Symbols (Turas Quality Improvement Zone)
Note there are many more symbols that can be used in process maps, try to ensure whatever you are using comes from an approved source and is a standardised/understandable format.