Intermediate Power BI Session 2
Power BI
beginner
This is part of our intermediate-level Power BI desktop course. The course structure is as follows:
- session 1: a simple build-a-dashboard session as a warmup, reminder about core Power BI techniques, and sharing some suggestions for good workflow practices
- session 2 (this session): DAX language foundations, including FILTER and CALCULATE
- session 3: core PowerQuery functions to manage sources, join data sets, pivot, and tidy values
- session 4: PowerQuery M language foundations, including a basic overview of syntax, a core function toolkit, advanced mode, and reproducibility
- session 5: a second, more ambitious, build-a-dashboard session to put all that PowerQuery and DAX knowledge into practice
Session materials
Previous attendees have said…
- 60 previous attendees have left feedback
- 100% would recommend this session to a colleague
- 97% said that this session was pitched correctly
Three random comments from previous attendees
- Great to learn the available tools and it have awareness of the restriction faced in various boards and general training on this software attempted from external sources became useless with NHS IT restrictions etc
- Really practical session. Felt as thought I was starting to understand linking data sources to provide refined visuals. I will need to practice to keep the skill up, as I think the theory could be lost if not used.
- Very well planned and oven ready files were very useful. Would maybe recommend assigning “homework” for folk to ensure we actually practice as this is where the success will lie. My main issue is with getting data into a format that is suitable - working across Board boundaries means the data I receive is different from each Board and wrangling is very manual and time consuming.
Session outline
- look at the foundations of DAX
- iterator functions
- filter context
FILTER()CALCULATE()
- variables
- calculation groups
Data
- this session uses a bit of synthetic data extending the Dundee traffic dataset from the previous session
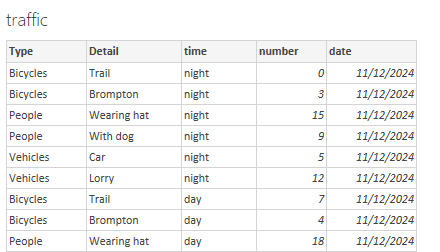
- please download the data from this link, and import into Power BI
DAX reminders
- functions vs formulas
- arguments and return values
- references
- columns vs measures
Column functions
- Many DAX functions can return either columns or measures
- let’s try a practical example:
Task
- in the
trafficdata, selectNew columnthen add the DAX formulatemp_col = 66 - now repeat with
New measurethentemp_measure = 66 - now add
temp_measureto a card on a new report page
Column vs measure
- your
temp_xxxfunctions will be identical: the value oftemp_measurewill be the same as each row of thetemp_colin your data - that’s because the filter context for the two calculations is currently the same
Standard DAX functions
Task
- now tweak your
temp_colformula to use theUPPERfunction on the[Detail]column:temp = UPPER(traffic[Detail]) - inspect the result
- now try a simple bit of control flow:
temp_col = IF(traffic[number] > 0 , "Found", "Not found") - again, that should work row-by-row
- what’s important: DAX functions in columns default to working in rows
- if you try the same formula in
temp_measureyou’ll cause an error: Power BI won’t know which row you want to change the case of - we’ll return to measures later
FILTER()
Task
- now update
temp_col = COUNTROWS(filter(traffic, traffic[number] = 3))
- note that this function now isn’t working row-by-row, but across the entire table
FILTER()has changed the default row-by-row context
Filter context
Task
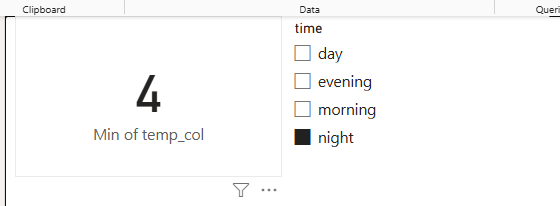
- to illustrate, please build a simple dashboard with:
- a card containing the minimum value of
traffic[temp_col] - a slicer containing
traffic[time]
- a card containing the minimum value of
- note that the value of temp seems to be incorrect - it’s the same no matter how the slicer is set
Iterator functions
Task
- add two new columns:
col_sum = SUM(traffic[number])col_sumx = SUMX(traffic, traffic[number])
- add two new measures
meas_sum = SUM(traffic[number])meas_sumx = SUMX(traffic, traffic[number])
- finally, add all 4 to cards, summarising by
minwhen necessary
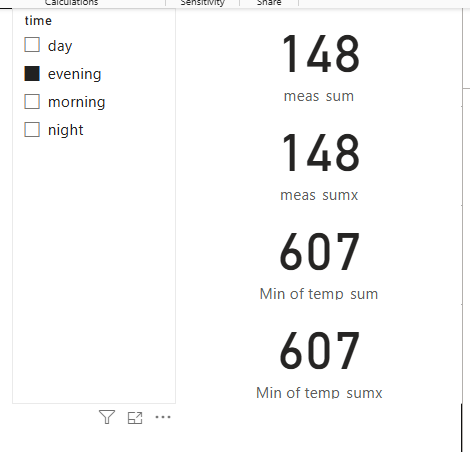
What’s the difference?
- in the measure,
SUM()takes the report filter context, and sums for that time of day - in the column,
SUM()calculates the total for an entire column - in both cases,
SUMX()gives the same result, but it calculates it in a different way…
SUMX()
Task
- to illustrate, change both
SUMXcalculations toSUMX(filter(traffic, traffic[number] < 15), traffic[number])
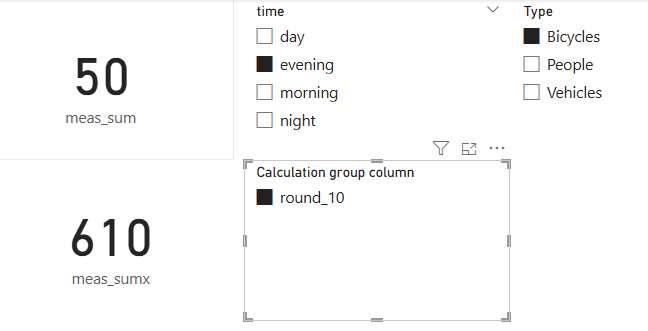
all four values will now disagree:
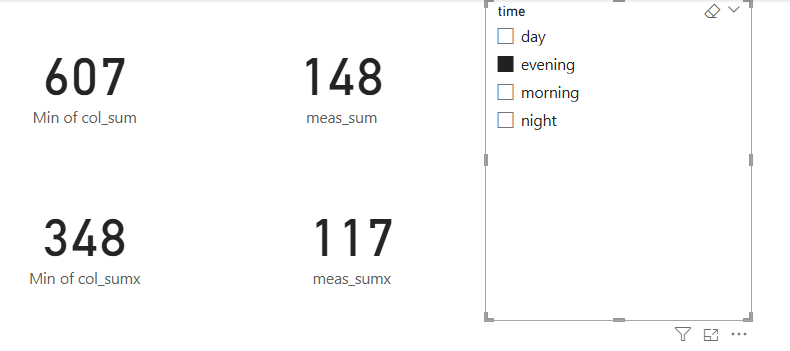 …
…col_sumis showing the total for the entire columnmeas_sumis showing the total for the filtered column (sotraffic[time]= morning)col_sumxis showing the total for the filtered column (values oftraffic[number]> 15 only)meas_sumxis showing the total for the doubly-filtered column (values oftraffic[number]> 15 wheretraffic[time]= morning)
SUMX() is an iterator
SUMX()calculates row-by-row- in our initial case, it was calculating row-by-row, and then aggregating all the rows
- when we added a filter,
SUMX()included rows meeting the filter condition
ALL()
- strictly,
SUM(x[y])is a sweetened form ofSUMX(ALL(x), x[y]) ALL()removes any filter context to include every row of a table
ALL() and CALCULATE()
- much of the power of DAX lies in that ability to alter the filter context. Let’s tweak
meas_sumto show that:
Task
meas_sum = CALCULATE(SUM(traffic[number]), ALL())- compare and contrast col_sum and meas_sum
CALCULATE()is a generic function that changes the filter contextALL(), as we’ve already seen, removes any filtering from the current filter context
ALLEXCEPT()
ALLEXCEPT()allows you to remove part of the filter context
Task
- add an additional slicer to your report slicing on
traffic[Type] - add a new measure with
meas_sum_time = CALCULATE(SUM(traffic[number]), ALLEXCEPT(traffic, traffic[time]))and add to a card
- that should give you a measure that reponds to
time, but not toType - this could be extended - e.g. to
meas_sum_type_time = CALCULATE(SUM(traffic[number]), ALLEXCEPT (traffic, traffic[Type], traffic[time]))
Variables
- DAX formulas get horrid quickly. In this section, we’ll demonstrate the use of variables
- add a new measure:
temp_var =
  VAR my_var = 66
  RETURN my_var
Variable considerations
- useful to avoid repeating yourself
- also useful for avoiding clutter (e.g. component measures)
- local scope - you can’t refer to variables in other expressions
- potentially improve performance
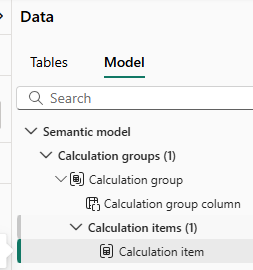
Calculation groups
- calculation groups are a way of applying functions to many measures at once
Task
- in the model view, select
Calculation group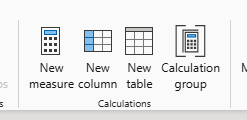
- select
Yeswhen warned about implicit measures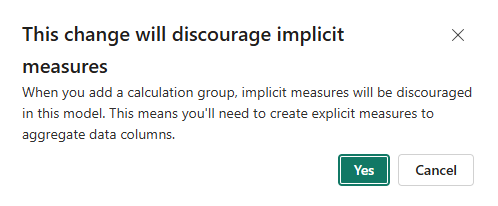
- that will add a new section to your model
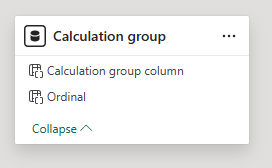
- select
Calculation itemin the Model sidebar
- add the formula
round_10 = ROUND(SELECTEDMEASURE(), -1)to the formula bar - back on the report page, add a slicer and populate with your Calculation group