Excel first steps (Excel for beginners session 1)
excel
beginner
Excel for beginners
This session is part of our Excel for beginners course. That’s a series of seven linked sessions, delivered on Teams, that give an introduction to Excel for people working in health and social care. The sessions are:
- Excel first steps (this session)
- Tidy data in Excel
- References and names in Excel
- Excel formatting
- Excel tables
-
Excel formulas
- and a final practical review session to help you put your new skills to work
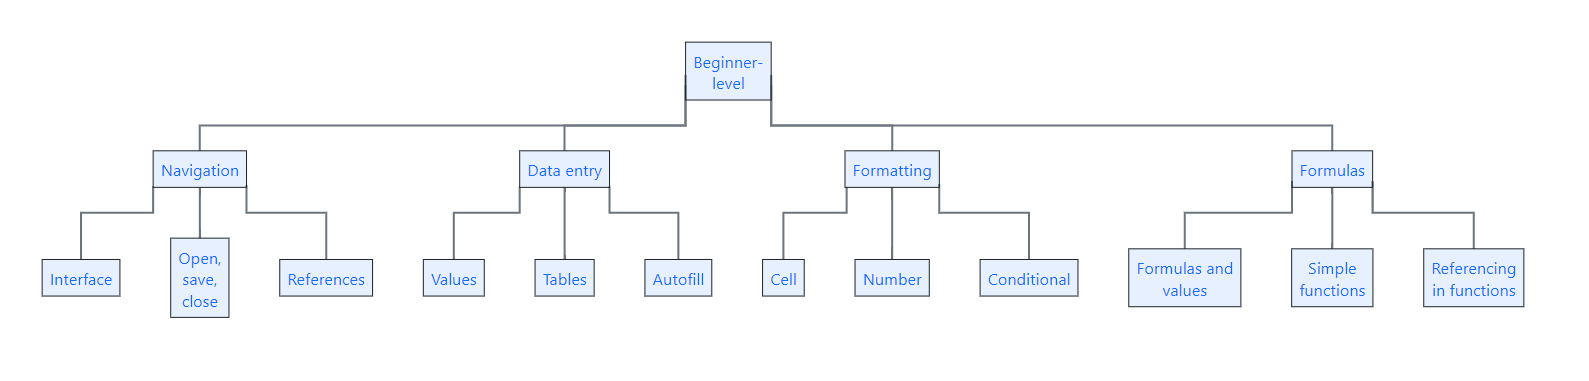
Together, they aim to help you develop an appropriate set of Excel skills to help your work. This session covers a general overview of our beginner’s skill tree:
- you might find the list of Excel shortcuts helpful too
Previous attendees have said…
- 193 previous attendees have left feedback
- 98% would recommend this session to a colleague
- 93% said that this session was pitched correctly
NoteThree random comments from previous attendees
- Good clear explanation of excel basics
- Very straightforward, showing basic skills but not overwhelming. Good session.
- clear and not scary!
Video overview
A brief overview of Excel

- one of the oldest, and most widely used, pieces of desktop software
- ubiquitous in business, finance, health and social care…
- proprietary, closed-source, paid-for
- many versions
But Excel is badly used, on the whole
- PHE lost 16k COVID19+ results
- MI5 bugged 134 people they didn’t mean to
-
JP Morgan 2012 had a manually-updated spreadsheet
- divided by sum, rather than average
- massive losses, $2 - $6 billion??
And most of us fall into Excel work…
- most of us haven’t had any data training
- e.g. in KIND network (which is a very techy group) 75% didn’t have a formal qualification
- and the responsibility for doing that data work well falls on many of us
- data work has become more prominent in lots of jobs
- but good data work is really important…
Good data helps…
- answering which/when questions
- seeing effects of changes
- comparing different areas
- looking at services over time
- …
One word of warning before the practical part
- there are lots of versions of Excel
- they all work slightly differently
- please don’t panic if what you see looks slightly different from what I’m showing you
- please ask if you’re not happy/confident!
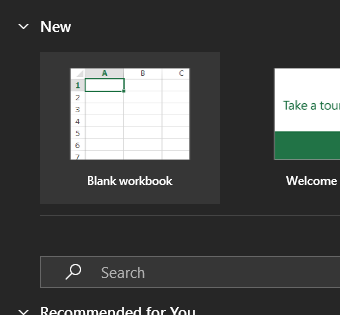
Opening Excel (desktop)
- find Excel in your Windows Start menu
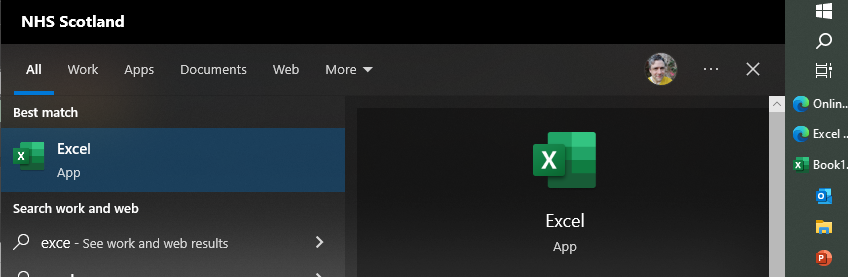
- you’ll need to create a new blank workbook
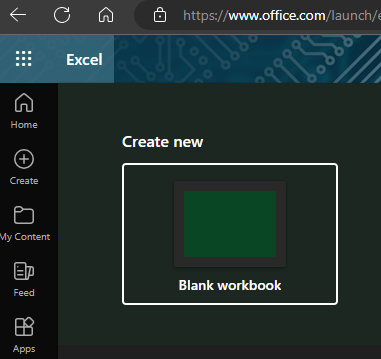
Opening Excel (web)
- usually at https://www.office.com/launch/excel
- you’ll need to create a new blank workbook
Interface
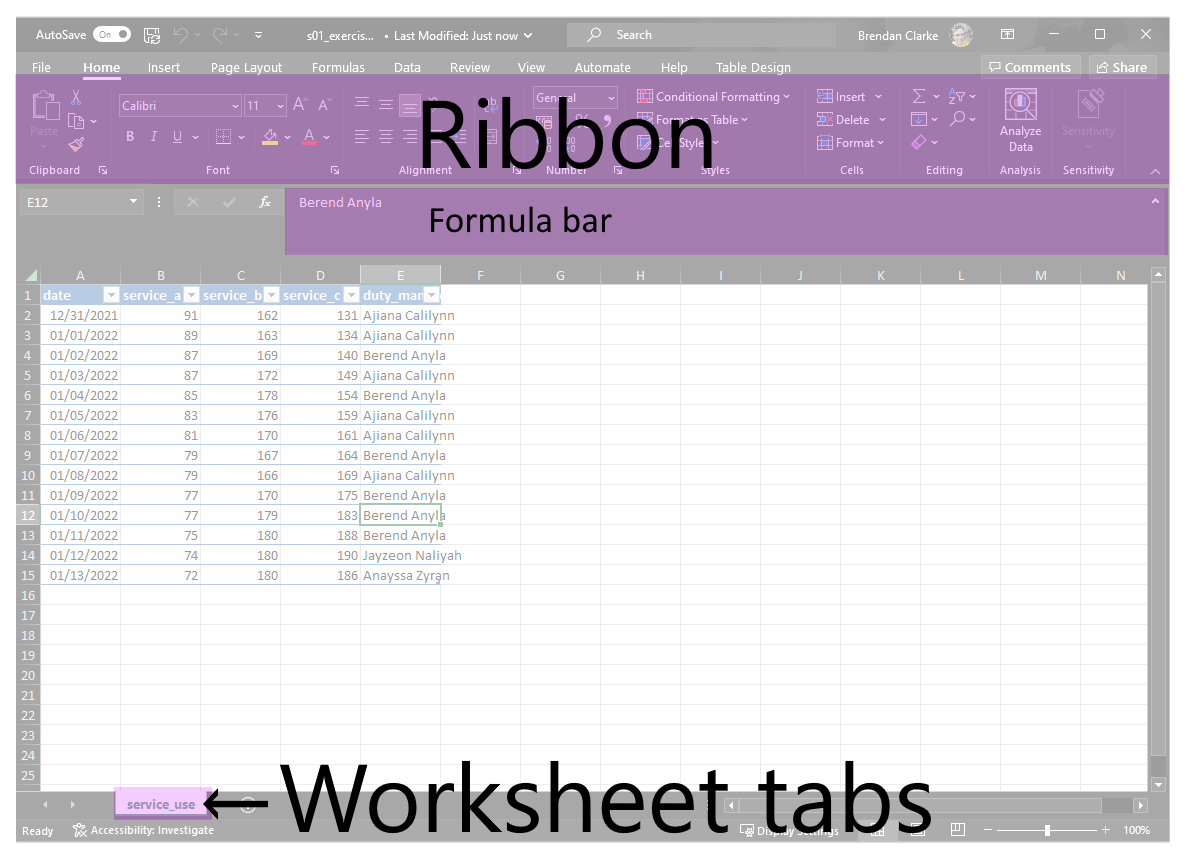
Central idea
- pieces of data are stored in cells
- one value, one cell
- cells are arranged into rows and columns
- arranging data like this allows us to analyse it
- it’s not just Word on a grid
Save, close, open
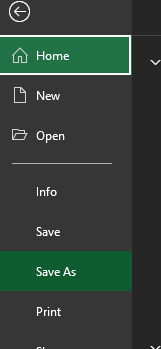
- save your new workbook
- close it
- re-open it (possibly from recent files)
Important
- We would strongly recommend that you don’t attempt any of these new techniques in your real data until you’re confident and happy about how they work
- We would also remind you to always back up your work. If you’re going to try a new technique, don’t do it in the only copy of your important workbook
- In fact, we’d suggest using made-up data only while practising your new Excel techniques. Working with real data makes it much harder to get help, because you can’t share your work with anyone
References
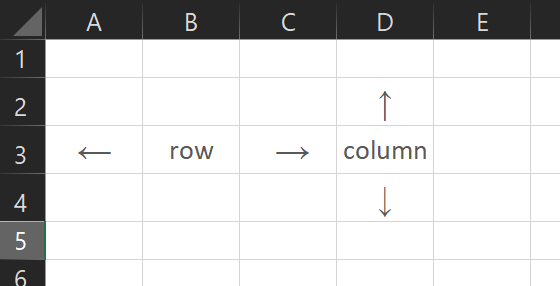
- every cell in Excel has a reference
- that’s effectively the address of the cell
- references look like this:
E7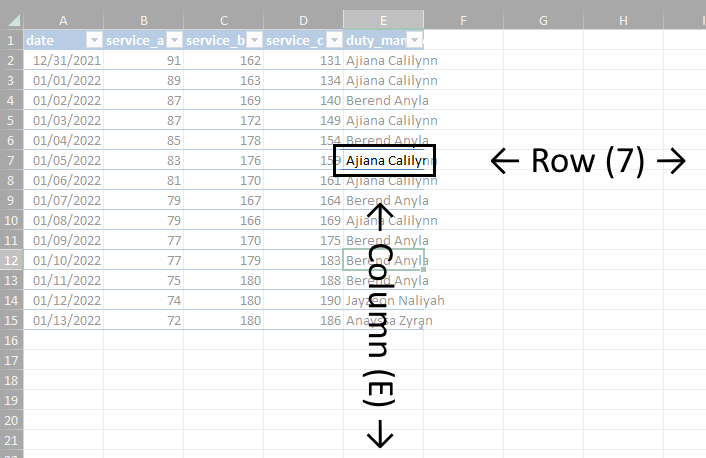
-
Erefers to a vertical column -
7to a horizontal row
-
Data entry
- let’s add some data…
- we can type into the cells
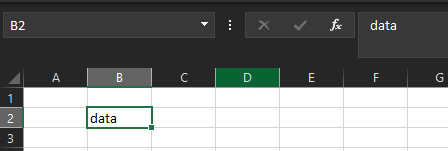
- that data appears in the formula bar too
An example: island populations
- The national records of Scotland has public data on island populations
- make three headings in row 1:
island,males,females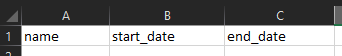
Values
- let’s add some values from the island populations data:
| island | males | females |
|---|---|---|
| Argyll Islands | 4427 | 4052 |
| Arran, Bute and the Cumbraes | 6218 | 5716 |
| Highland Islands | 5415 | 5249 |
| Lewis and Harris, Great Bernera and Scalpay | 10166 | 10006 |
| Orkney - Mainland and connected | 9862 | 9450 |
Tidy data
- keep things consistent - spelling, case, formats, etc
- one piece of data per cell
- one instance per row (one island per row)
- one variable per column (a column of male counts, and and a column of female)
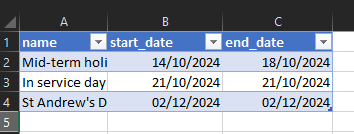
Tables
- we can convert this group of cells into a proper table
- click in one of your cells of data
-
Insert>Table(orCtrl+T)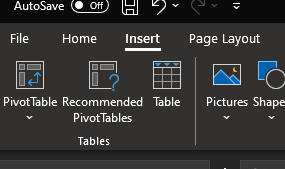
- click
OK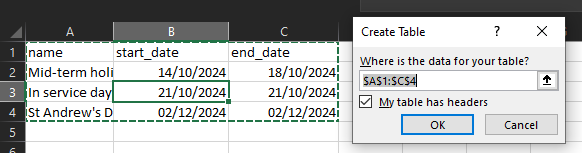
Lots of new things to see
Autofill
- we’ll add a formula to calculate the total population
- add a new column called
total - paste or type
= B2 + C2into the first cell of that new column- and look out for our session on formulas…
- double-click the green fill handle to fill the rest of the column
Formatting
- we can change the way that our spreadsheet looks
- we can also change the way our values look
Cell formatting
- some examples
- highlighting
- bold
- borders
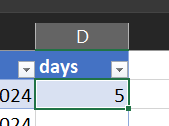
Number formatting
- we can format the numbers in our sheet to change their appearance
- we’ll demonstrate some examples during the session where we make our values work as percentages, currency, dates, etc
- that’s done using the number formatting area of the ribbon menu
Conditional formatting
- we can also format based on values
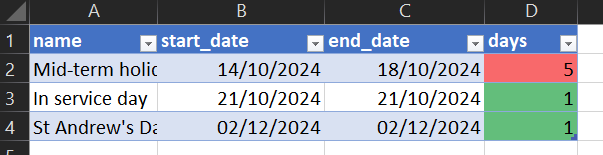
- take care though - this can be both ugly, and inaccessible