Tidy data in Excel (Excel for beginners session 2)
excel
beginner
Excel for beginners
This session is part of our Excel for beginners course. That’s a series of seven linked sessions, delivered on Teams, that give an introduction to Excel for people working in health and social care. The sessions are:
- Excel first steps
- Tidy data in Excel (this session)
- References and names in Excel
- Excel formatting
- Excel tables
-
Excel formulas
- and a final practical review session to help you put your new skills to work
Together, they aim to help you develop an appropriate set of Excel skills to help your work. This session covers:
- for this session, you’ll need to be familiar with the Excel basics (getting around in Excel, opening/saving/closing files, and a little bit of A1 referencing)
- we’re going to dodge formatting and formulas as much as possible today
- you might find the list of Excel shortcuts helpful too
Previous attendees have said…
- 172 previous attendees have left feedback
- 97% would recommend this session to a colleague
- 92% said that this session was pitched correctly
NoteThree random comments from previous attendees
- Fantastic session clearly explained excellent session. Highly recommended to my team to get signed up for some sessions!
- Quite interesting, but am missing the input of Brendan’s colleague Vay Ly ? - I found the sessions when Vay took part very helpful too, as we got a different slant on things, which was so beneficial.
Good session though, thank you. - Really informative most of the material I kind was aware of but was good to see it applied
Video overview
Session outline
- a word of warning
- understanding tidy data
- a practical introduction to making tidy data
- text to columns
- transposing
A word of warning
- tidying data can be very slow and complicated
- in Excel, there are lots of advanced tools that can speed things up
- this is a beginner’s session, so we’ll avoid the more fancy tools
- but if your process takes lots of manual work, it’s definitely worth exploring alternative ways of working
Tidy data
| year | 25-29yrs | 30-34yrs | 35-39yrs |
|---|---|---|---|
| 2018 | 73.4 | 90.9 | 54.2 |
| 2019 | 71.0 | 88.6 | 52.7 |
| 2020 | 66.8 | 83.4 | 49.4 |
| 2021 | 69.6 | 85.9 | 52.8 |
| 2022 | 66.7 | 84.4 | 52.0 |
- one value per cell
- each column contains all the values of one measurement
- each row shows all the values for one year
Entering values
- imagine that we want to measure something across several years:
2018, 2019, 2020, 2021, 2022? - practical:
- open Excel
- start a new workbook
- add a column header
yearin cellA1 - then add each of those five years values in the five cells underneath (down to
A6)
More values
- we’re going to be using some birthrate data from the NRS for this session. We’ll start by adding some birth rate data
- this is given as births per 1,000 women in five year age brackets. We’ll start with 25-29 year old mothers
- please add the header
25-29yrsin cellB1 - here are the values for our five years:
73.4, 71, 66.8, 69.6, 66.7
Another column
| 30-34yrs |
|---|
| 90.9 |
| 88.6 |
| 83.4 |
| 85.9 |
| 84.4 |
- please could you add some new data to your table showing births for another age group
Back to tidy data
- we’ve now got some data with:
- each value in a cell
- each variable in a column
- here, this is a maternal age bracket
- each observation in a row
- here, this is a year
Fixing several values per cell
- We often find useful data with more than one value per cell
- this can be helpful for humans
- Excel can’t do anything with this data
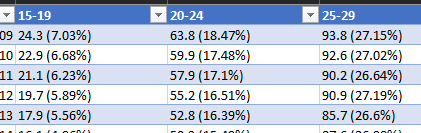
Exercise: many values per cell
| 35-39 |
|---|
| 54.2 (21%) |
| 52.7 (20%) |
| 49.4 (19%) |
| 52.8 (20%) |
| 52 (20%) |
- please add this column of data to your table
- does it look similar to your existing data?
What’s the solution?
- make this data have one value per cell
- we could remove all the percentages by hand
-
Text to Columnsgives us a better tool for the job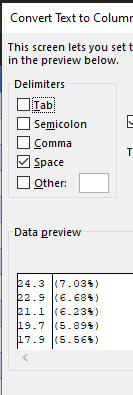
Text to Columns
- select a column
- in the
Datatab of the ribbon, you should find theText to Columnstool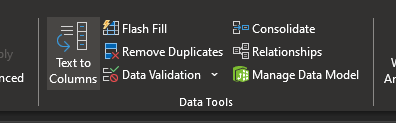
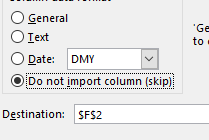
- note that you can keep, or remove, the percentage column. We’ll skip it, to keep things simple
Exercise: transposed data
| Bracket | 2018 | 2019 | 2020 | 2021 | 2022 |
|---|---|---|---|---|---|
| 25-29yrs | 73.4 | 71.0 | 66.8 | 69.6 | 66.7 |
| 30-34yrs | 90.9 | 88.6 | 83.4 | 85.9 | 84.4 |
| 35-39yrs | 54.2 | 52.7 | 49.4 | 52.8 | 52.0 |
- sometimes you’ll find data where the columns and rows have been flipped
- that’s slow to fix by hand, but luckily you can transpose it, which swaps rows and columns
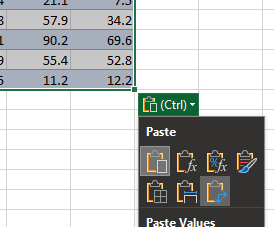
- select your data, and copy/paste into a new cell
- then use the transpose option