Excel practical review (Excel for beginners session 7)
This session is part of our Excel for beginners course. That’s a series of seven linked sessions, delivered on Teams, that give an introduction to Excel for people working in health and social care. The sessions are:
- Excel first steps
- Tidy data in Excel
- References and names in Excel
- Excel formatting
- Excel tables
-
Excel formulas
- and a final practical review session to help you put your new skills to work (this session)
Together, they aim to help you develop an appropriate set of Excel skills to help your work.
- in this session, we’ll give you a chance to practice the material from the earlier sessions
- we’ll do that using a series of nine practice tasks based on real work tasks we’ve experienced
- you might find it helpful to use the links above to view material from earlier sessions to help you today
Background
- You are a member of a team at a Local Authority office. Your supervisor tells you that they have received population data for three separate years, across two Council Areas
- Using Excel, we’ll start by recording the data you have been given
- We need that data to be easy to understand, and accessible, to allow for later work
- but beware: your supervisor thinks they know how to use Excel, but might not always give you the best instructions…
Task 1: data entry
Another long day at work, and your supervisor is pestering you to create a spreadsheet of population data.
- Open a new Excel workbook, and save it as
Population Datain an appropriate location - Add the data that your supervisor has sent you to your spreadsheet:
| City | |||
|---|---|---|---|
| Aberdeen City | 212,125 (2001) | 222,793 (2011) | 224,021 (2022) |
| Glasgow City | 577,869 (2001) | 593,245 (2011) | 620,756 (2022) |
Task 2: tidy data
On reflection, that data doesn’t look quite right.
- Please edit it to make sure it follows the tidy data rules
Task 3: extra data
Just as things are looking tidy, your supervisor comes to you with more data to add
- Follow your earlier format and add an extra row containing the following values:
Fife: 349,429 (2001), 365,198 (2011), 371,781 (2022)
Task 4: transposing
Disaster! your supervisor has changed their mind about what should go in the rows, and what should go in the columns.
- Please transpose your data/range of cells so that your Council Areas are the columns, and the years are the rows
- You’ll need to manually rename the column with the years in to
year
Check in 1
Your data should now look like this:
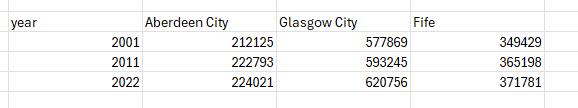
You can delete any other data from your working out as we won’t need it later on. You might also like to use the Clear formats tool to remove any odd bits of formatting left over from transposing etc.
Task 5: tables
Your supervisor is now worried that someone will sort parts of the data and break it. You remember that you can use a table to prevent that from happening.
- Turn this data into a proper table with headers
- Name your table ‘population_data’
Task 6: even more data
As your supervisor clearly doesn’t know when to stop, they come to you with more data:
Falkirk: 145,191 (2001), 155,990 (2011), 158,404 (2022)
- Please enter that data into your table, extending as necessary
- You might like to use
Paste values only, or theClear formattingtool to make sure the new values look like the existing values
Task 7: formatting
Let’s make our table easier to read.
- Make the values in the
yearcolumn bold - Then left-align the values in the
yearcolumn
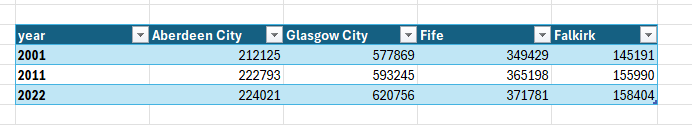
Check in 2
Your data should now look like this:
Task 8: a total
From giving you data, your supervisor has now decided to start asking you questions about the data. First, they wonder what the total population was for each of the three years:
- Add a
Totalcolumn to your table - In the first cell of that column, write a formula to add together the four population values. You can do that with
SUM, or using+to add values together - Then copy your formula down to fill the remaining cells in the
totalcolumn
Task 9: an average
Although there’s only a minute or two left of the working day, your supervisor is still at it, with what they promise to be the last request: can you calculate an average for each of the three years too:
- Add an
averagecolumn to your table - In the first cell of that new column, write a formula using the
AVERAGEfunction to find the average population in each of the three years - Then copy your formula down to fill the remaining cells in the
averagecolumn
Completed!
Well done for getting through a trying afternoon. Here’s how the spreadsheet should look:
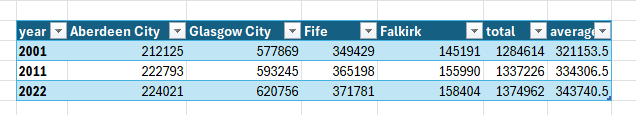
If you’re stuck with the formulas, you can also use these examples.:
- the
totalformula is=SUM(population_data[@[Aberdeen City]:[Falkirk]]). These structured references are how modern versions of Excel creates references in tables, and we’ll discuss those in our intermediate-level Excel course. - you might also write that using A1 references as
=SUM(C3:F3). Take care that your data starts where this example data does - with the Aberdeen City data in Column C, starting at row 3. You might need to adapt your formula to suit! - the
averageformula is=AVERAGE(population_data[@[Aberdeen City]:[Falkirk]]) -
=AVERAGE(C3:F3)would also work